As I’m working on this, 03-2022, Google Optimize uses session-based data instead of unique user-based data. It’s very important to realize that users and sessions aren’t the same. It’s more likely that you would need to use the user’s metrics rather than sessions.
When using sessions to calculate your conversion ratio (or CTR or any other goals) the problem is that one user can have multiple sessions. So somebody has taken a look at your website multiple times before buying something. This directly impacts your conversion ratio. User Conversion Rate is there for the better option to go with.
The user conversion rate is based on individual users rather than multiple sessions. The next question would be, how do you get this data?
Google Optimize is session-based, in the future this might change when we move to GA4. For now, that’s not the case. In order to get this information, there are two paths you can follow. The first path is to create a custom report, the second path is to create segments based on your experiment ID. In this article, I’ll show you the first path.
Let’s go through these steps and walk through them together.
1. Open up Google Optimize
2. Go to your running/past experiment
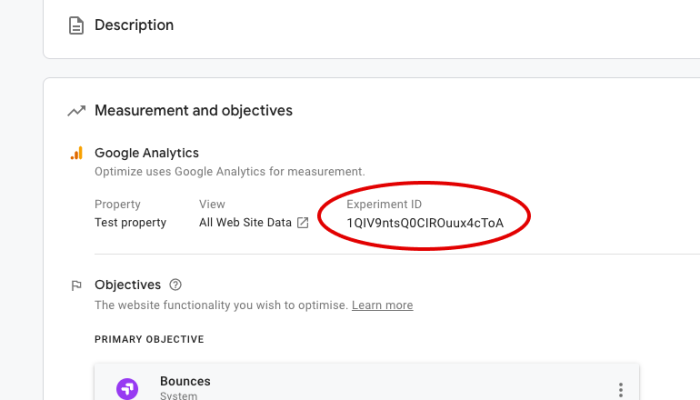
3. Go to the Details tab
4. Scroll down and copy the experiment ID
5. Let’s continue with the Google Analytics steps now (make sure to keep the experiment ID on your clipboard)
1. Open your Google Analytics account and the view that’s connected to Google Optimize
2. Left menu op Customization > Custom Reports
3. Click the button ‘+ NEW CUSTOM REPORT’
4. Give the custom report the same title as your experiment
5. Click the blue area to add metrics
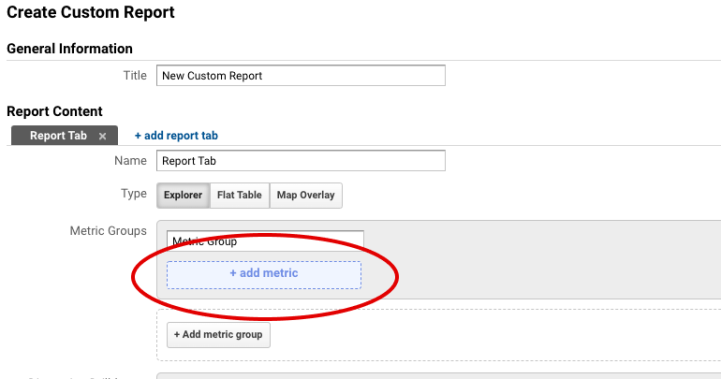
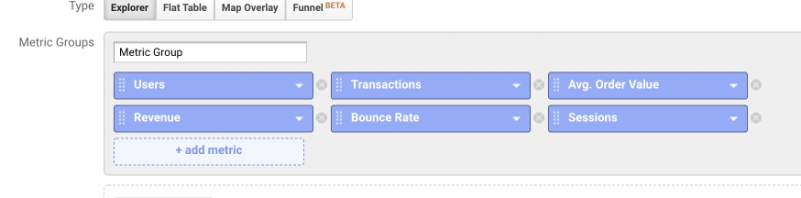
6. Add the metric Users and the metrics you’re using as goals like Conversion Rate, Bounce Rate, Transactions, etc.
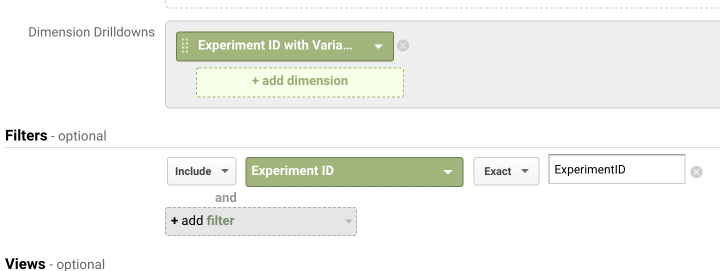
7. Click on the green area Dimension Drilldowns
8. Select Experiment ID with Variant9. Add filters to filter all experiment data. Click the ‘+add filter’ button
10. Select Experiment ID
11. It should be: Include > Experiment ID > Exact > The ID you copied from Google Optimize
12. Hit the save button
13. No data? Make sure you’ve selected the time range the experiment was active
14. You’re done!
Congratulations! From now on, you’ll make better decisions with your experiment data.
CRO specialist based in Groningen. I help companies increase revenue by optimizing their conversion funnel.
Schedule call